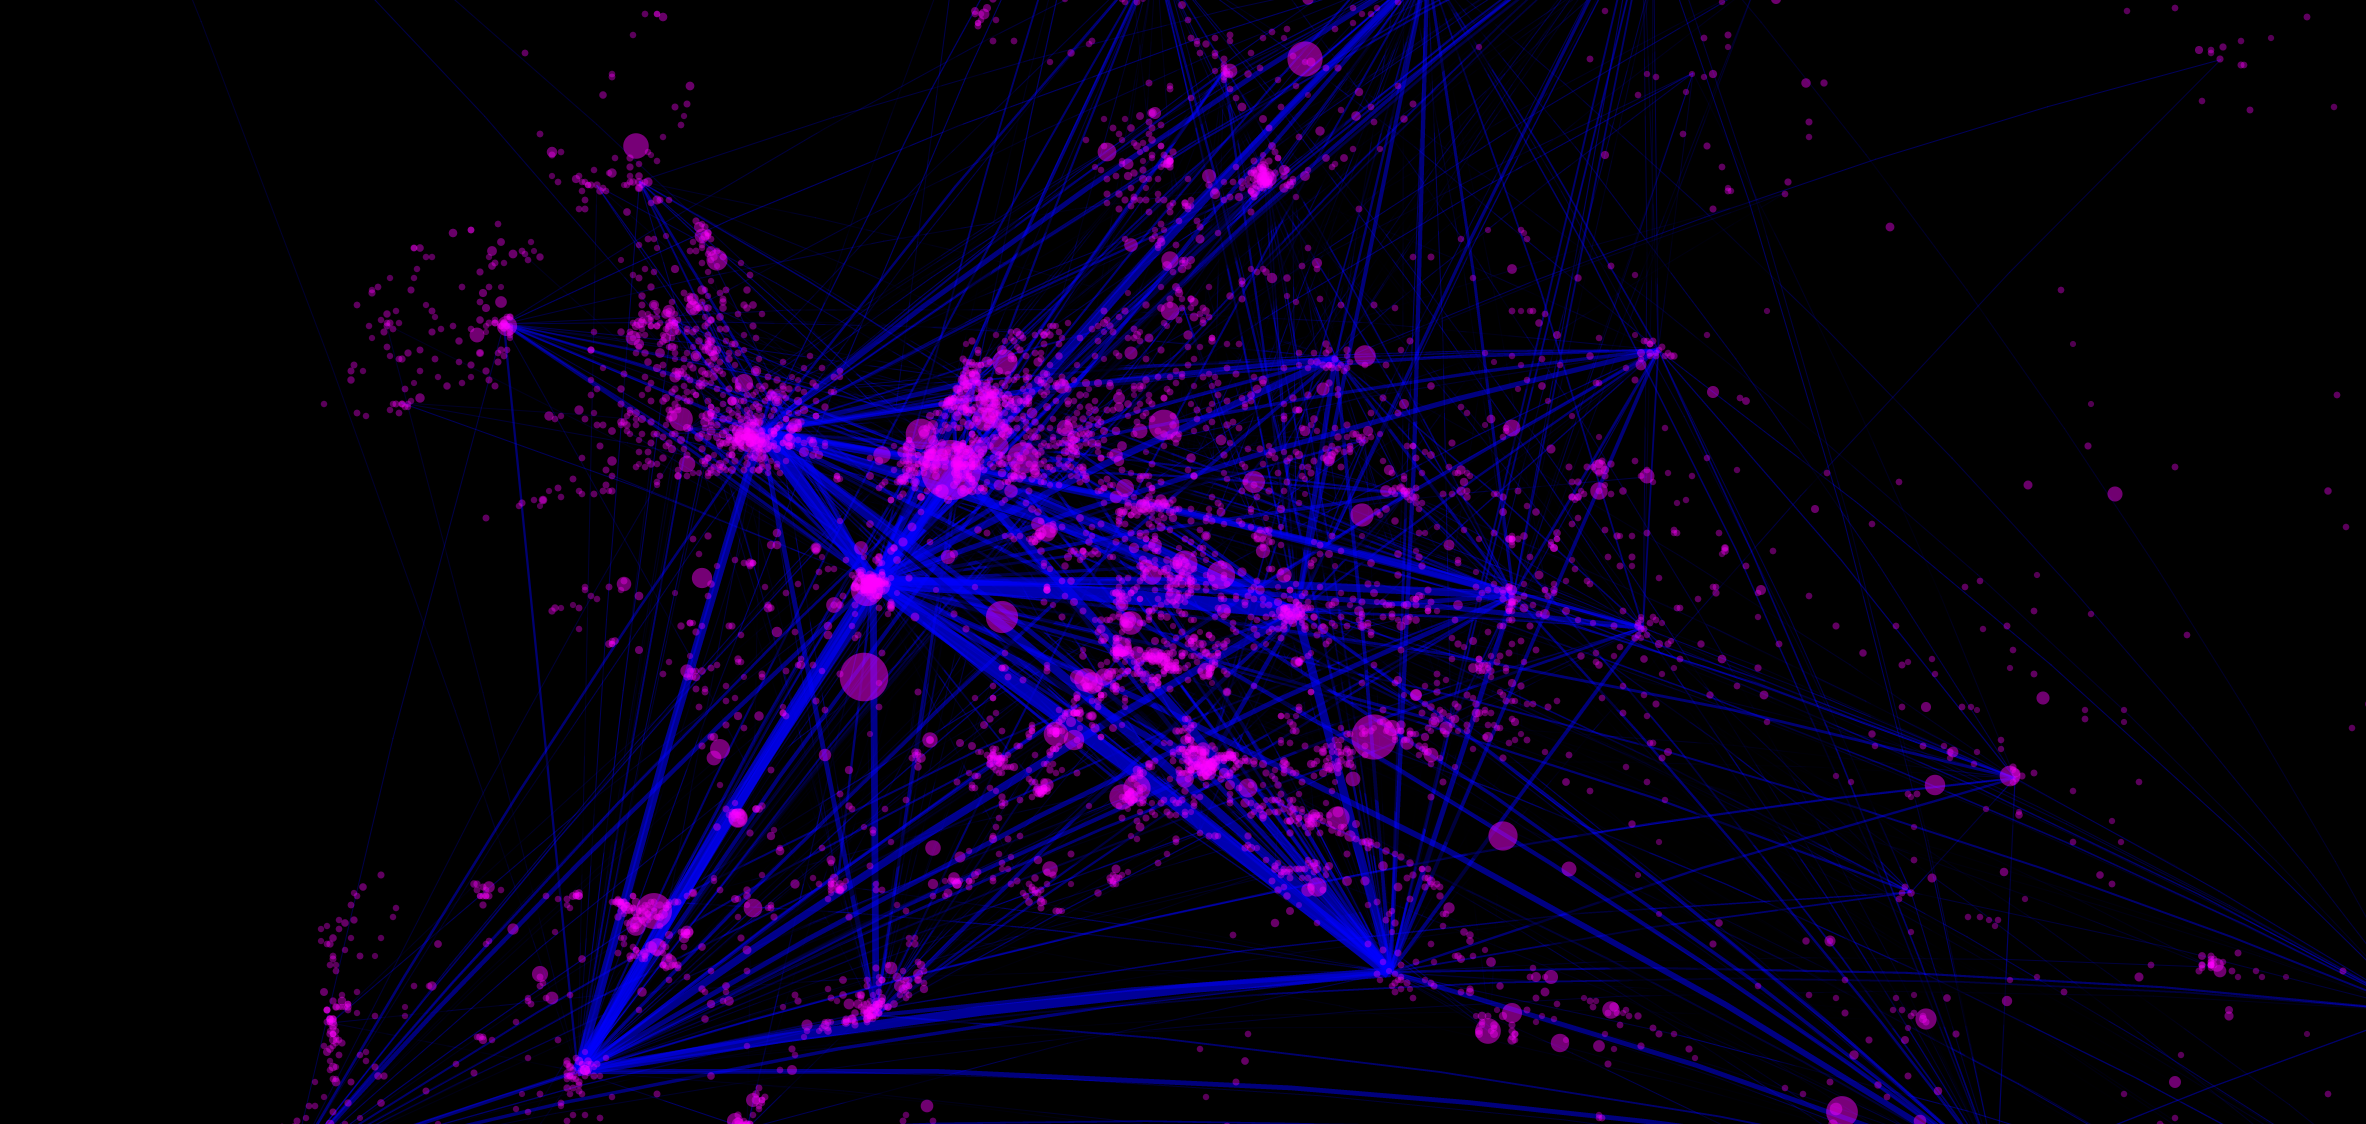
EU research collaboration networks with D3
I want to learn more about D3.js, so I decided to try my hand on recreating the plot from [one of my earlier posts] ](/2016/collaboration-network-EU-fp7.html) originally done in R. I’m not so happy with the somewhat randomly chosen color scheme of the map. I might change that later.
var width = 800,
    height = 800;
var radius = 2;

var svg = d3.select( "svg" )
  .attr( "width", width )
  .attr( "height", height );

svg.append("rect").attr("x", 0).attr("y", 0).attr("width", width).attr("height", height)

var g = svg.append( "g" ).attr("render-order", -1);

var projector = d3.geoAzimuthalEqualArea()
  .scale( 1200 )
  .center( [10, 53] )
  .translate( [width/2, height/2] );

var geoPath = d3.geoPath()
    .projection( projector );

g.selectAll( "path" )
  .data( europe_json.features )
  .enter()
  .append( "path" )
  .attr( "fill", "none" )
  .attr( "stroke", "#333333" )
  .attr( "d", geoPath );

function row_points(d) {
	return {
    lon   : +d.lon,
    lat   : +d.lat,
    city  :  d.address,
    contr : +d.city_contribution
  };
}

function render_points(data){
	var g = svg.append( "g" ).attr("render-order", 1);

	data = data
		.map(function(d) {
			var xy = projector([d.lon, d.lat]);
			return {
				lon: d.lon,
				lat: d.lat,
				wt: d.contr,
				x: Math.round(xy[0]),
				y: Math.round(xy[1])
			};
		})
		.filter(d => d.x > 0 & d.x < width &
  		           d.y > 0 & d.y < height);

	var radius = d3.scaleSqrt()
		.domain(d3.extent(data.map(d => d.wt)))
		.range([1,10]);

	var alpha = d3.scaleLog()
		.domain(d3.extent(data.map(d => d.wt)))
		.range([0.5, 1]);

  //bind data
	var pts = g.selectAll("circle").data(data);

	pts.enter()
	  .append("circle")
		.attr("cx", d => d.x)
		.attr("cy", d => d.y)
		.attr("r", d => radius(d.wt))
		.style("opacity", d => alpha(d.wt));

}


function row_arcs(d) {
	return {
    arcs : {
    	type: "LineString",
    	coordinates: [[+d.lon1, +d.lat1], [+d.lon2, +d.lat2]]
    },
    wt   : +d.n
  };
}

function render_arcs(data){
	var arcs = svg.append("g")
	  .selectAll("path")
	  .data(data)
	  .enter()
	  .append("path");

	var alpha = d3.scaleLinear()
		.domain(d3.extent(data.map(d => d.wt)))
		.range([0.4, 0.7]);

	var stroke = d3.scaleLinear()
		.domain(d3.extent(data.map(d => d.wt)))
		.range([0.1,5]);

	arcs
	  .attr("d", d => geoPath(d.arcs))
	  .style("stroke", "blue")
	  .style("opacity", d => alpha(d.wt))
	  .style("stroke-width", d => stroke(d.wt))
	  .style("fill", "none");

	d3.csv("/assets/posts_data/2016-11-26/city_contributions.csv")
		.row(row_points)
		.get(render_points);
}

d3.csv("/assets/posts_data/2016-11-26/connections.csv")
		.row(row_arcs)
		.get(render_arcs);
Stay in touch
Hi, I'm Märt Toots. This is my blog about things that interest me, mostly about various mini-projects in R and D3.